

Introduction: The Financial Seasons Every Investor Must Understand
Just as nature moves through predictable seasons, financial markets follow recurring cycles of growth and contraction. Understanding these patterns isn’t about predicting the future; it’s about preparing for inevitable changes and maintaining perspective during emotional extremes.
As an educator, I appreciate that recognizing patterns helps students navigate complexity. The same applies to investing. Research from the CFA Institute shows that investors who understand market cycles significantly outperform those who don’t, primarily by avoiding emotional decisions at cycle extremes.
Consider this historical perspective: Since 1928, the S&P 500 has experienced:
- 15 bear markets (declines of 20% or more)
- 14 bull markets (gains of 20% or more)
- 56 corrections (declines of 10-19%)
- 0 instances of permanent decline over 20-year periods
In this article, we’ll explore the science behind market cycles, the psychology that drives them, and evidence-based strategies to navigate them successfully.
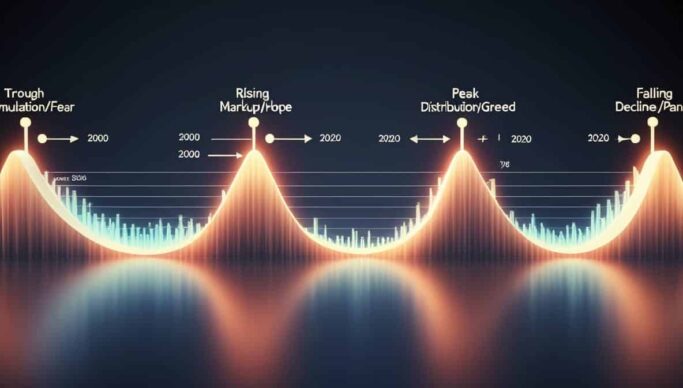
The Anatomy of Market Cycles: The Four Seasons of Investing
Phase 1: Accumulation (The Silent Spring)
Characteristics:
- Market sentiment: Pessimistic, fearful
- Economic data: Mixed or negative
- Investor behavior: Capitulation, disengagement
- Valuation: Attractive, often undervalued
Historical Example:
Early 2009 following the financial crisis:
- S&P 500 P/E ratio: 13.3 (historical average: 15-16)
- Investor sentiment: Extreme fear (VIX above 40)
- Headlines: “Worst crisis since Great Depression”
- Opportunity: S&P 500 gained 26% in 2009, 15% in 2010
The Data:
A Dimensional Fund Advisors study found that buying during high-fear periods (VIX > 30) led to substantially higher 3-year returns compared to low-fear periods.
Phase 2: Markup (The Summer Growth)
Characteristics:
- Market sentiment: Growing optimism
- Economic data: Improving
- Investor behavior: Gradual participation
- Valuation: Fair to slightly overvalued
Historical Example:
2010-2014 recovery:
- Steady economic improvement
- Gradual investor confidence return
- Consistent but unspectacular returns
- Character: 2013: +32%, 2014: +14%
The Psychology:
During this phase, recency bias causes many investors to remain cautious based on recent pain, causing them to miss early gains.
Phase 3: Distribution (The Autumn Harvest)
Characteristics:
- Market sentiment: Euphoric, greedy
- Economic data: Strong, sometimes peaking
- Investor behavior: FOMO (Fear Of Missing Out)
- Valuation: Overvalued by historical measures
Historical Example:
Late 1999 dot-com bubble:
- S&P 500 P/E: 28+ (well above historical average)
- Margin debt at record highs
- “New era” thinking prevalent
- Warning signs: Irrational exuberance, valuation extremes
The Data:
Robert Shiller’s CAPE ratio (Cyclically Adjusted P/E) identified the 1929, 2000, and 2007 market peaks as extreme overvaluation periods.
Phase 4: Decline (The Winter Contraction)
Characteristics:
- Market sentiment: Denial turning to panic
- Economic data: Deteriorating
- Investor behavior: Capitulation, selling
- Valuation: Becoming attractive again
Historical Example:
2008 Financial Crisis:
- S&P 500 decline: -37%
- Credit markets frozen
- Massive government intervention required
- Bottom: March 2009, followed by historic recovery
The Pattern:
NBER data shows the average post-WWII bear market lasts 13 months with 33% decline, while the average bull market lasts 64 months with 267% gain.
The Psychological Cycle: How Emotions Drive Markets
The Anatomy of Investor Psychology
1. Disbelief → Hope → Optimism → Belief → Thrill → Euphoria → Complacency → Anxiety → Denial → Fear → Desperation → Panic → Capitulation → Despondency → Depression → Hope
This emotional cycle, documented by Dr. John Templeton, repeats with remarkable consistency across market cycles.
The Neuroscience of Market Extremes
MRI studies from Stanford University show that:
- During market euphoria, dopamine levels surge, impairing risk assessment
- During panics, amygdala activation (fear center) overwhelms prefrontal cortex (rational thinking)
- This biological response explains why cycles become self-reinforcing
The Herding Instinct
Research from the University of Chicago demonstrates that social validation drives extreme market moves:
- 95% of investors follow crowd behavior during market extremes
- This creates buying peaks and selling valleys
- The 5% who resist herd mentality capture most long-term returns
Identifying Cycle Phases: Evidence-Based Indicators
Valuation Metrics
1. Shiller CAPE Ratio
- Measures P/E using 10 year average earnings
- Historical range: 5-45
- Current level: [Check current data]
- Significance: Readings above 25 often precede below-average returns
2. Buffett Indicator
- Total stock market capitalization / GDP
- Historical range: 50-150%
- Significance: Readings above 100% suggest overvaluation
3. Price-to-Sales Ratio
- Useful during earnings disruptions
- Historical average: ~1.5
- Significance: Readings above 2.0 warrant caution
Sentiment Indicators
1. VIX (Fear Index)
- Measures expected volatility
- Normal range: 10-20
- Extreme fear: >30 (often buying opportunity)
- Complacency: <15 (often caution warranted)
2. AAII Investor Sentiment Survey
- Measures individual investor bullishness
- Contrarian indicator: Extreme bullishness often precedes declines
- Historical pattern: >50% bullish = caution, <25% bullish = opportunity
3. Put/Call Ratio
- Measures options trading sentiment
- High readings: >1.0 (fearful, potentially bullish)
- Low readings: <0.7 (complacent, potentially bearish)
Economic Indicators
1. Yield Curve
- Relationship between short and long-term rates
- Inversion (short rates > long rates) often precedes recessions by 12-18 months
- Historical accuracy: 7 of last 8 inversions predicted recessions
2. Unemployment Claims
- Leading indicator of economic health
- Rising claims: Potential economic softening
- Falling claims: Economic strength
3. Manufacturing PMI
- Purchasing Managers Index
- Above 50: Expansion
- Below 50: Contraction
- Rapid declines: Often precede economic slowdowns
Evidence-Based Strategies for Each Cycle Phase
Phase 1 (Accumulation): The Contrarian Opportunity
Recommended Actions:
- Systematic investing: Continue or increase regular contributions
- Rebalance: Buy underweighted assets
- Quality focus: Purchase high-quality companies at discounted prices
- Patience: Accept that recovery may take time
Your Path Forward:
A Fidelity study found that investors who increased contributions during the 2008-2009 crisis saw portfolio values grow 150%+ over the following five years.
Phase 2 (Markup): The Growth Phase
Taking Control:
- Maintain discipline: Stick to asset allocation
- Automate investments: Remove emotion from decisions
- Avoid performance chasing: Stay diversified
- Tax efficiency: Harvest losses strategically
Psychological Challenge:
Overcoming the urge to take profits too early out of recent trauma memory.
Phase 3 (Distribution): The Risk Management Phase
Recommended Actions:
- Rebalance regularly: Take profits from winners
- Raise cash if needed for short-term goals
- Review risk exposure: Ensure alignment with time horizon
- Avoid new speculation: Don’t chase obvious bubbles
Data Insight:
Vanguard research shows that systematic rebalancing during overvalued markets improves long-term returns by 0.5% annually.
Phase 4 (Decline): The Preservation Phase
Recommended Actions:
- Stay invested: Time, not timing, matters most
- Quality check: Ensure holdings remain fundamentally sound
- Tax-loss harvesting: Offset gains with strategic losses
- Opportunity watch: Identify quality assets becoming undervalued
Historical Perspective:
Missing the best market days severely impacts returns:
- 1990-2020: Missing the 10 best days reduced returns from 7.9% to 4.5% annually
- The challenge: The best days often cluster near the worst days
Common Cycle Navigation Mistakes
1. Market Timing Attempts
Evidence: A Dalbar study found that market timing reduces average investor returns by 4-5% annually compared to buy-and-hold.
2. Emotional Decision-Making
Data: Fidelity’s best-performing accounts were those where owners had forgotten about them or died, eliminating emotional decisions.
3. Overreacting to Media
Research: University of California studies show that reducing financial media consumption improves investment returns by reducing unnecessary trading.
4. Abandoning Strategy During Stress
Pattern: The average investor holds strategies for just 3-5 years, often abandoning them at cycle extremes.
Your Cycle Navigation Action Plan
Quarter 1: Education & Preparation
- Learn to identify key cycle indicators
- Create or review your Investment Policy Statement
- Establish automatic investment schedule
- Set up system for regular rebalancing
Quarter 2: Implementation
- Begin systematic investing according to plan
- Set alerts for key indicator levels
- Establish media consumption boundaries
- Practice emotional regulation techniques
Quarter 3: Monitoring & Adjustment
- Review portfolio against benchmarks
- Check sentiment and valuation indicators
- Rebalance if allocations drift 5%+
- Journal emotional responses to market moves
Quarter 4: Review & Planning
- Assess annual performance vs. plan
- Update financial goals and time horizons
- Review and adjust IPS if needed
- Plan for next year’s contributions
Advanced Cycle Strategies for Experienced Investors
Tactical Asset Allocation
- Small adjustments (±10%) based on cycle extremes
- Requires strict discipline and rebalancing rules
- Evidence: Morningstar research shows modest tactical shifts can improve risk-adjusted returns
Sector Rotation
- Different sectors outperform in different cycle phases
- Early cycle: Cyclicals, financials
- Late cycle: Defensives, staples
- Challenge: Requires precise timing often missed in practice
The Barbell Strategy
- Conservative assets (bonds, cash) + Growth assets (stocks)
- Provides stability while maintaining growth exposure
- Benefit: Reduces emotional stress during declines
Historical Case Studies: Lessons from Past Cycles
Case Study 1: The 2000 Dot-Com Bubble
Cycle Phase: Distribution → Decline
Psychology: “This time is different” thinking
Lesson: Valuation matters, eventually
Case Study 2: The 2008 Financial Crisis
Cycle Phase: Decline → Accumulation
Psychology: Extreme fear creating opportunity
Lesson: Courage during fear creates wealth
Case Study 3: The 2020 COVID Crash
Cycle Phase: Sharp decline → Rapid recovery
Psychology: Panic followed by disbelief at recovery speed
Lesson: Staying invested through crises preserves wealth
The Ultimate Cycle Navigation Principle
“Be fearful when others are greedy, and greedy when others are fearful.” – Warren Buffett
This famous quote encapsulates the contrarian approach that has driven investment success for decades. The challenge isn’t understanding the principle; it’s implementing it when emotions run high.
Conclusion: Your Compass Through Financial Seasons
Market cycles aren’t anomalies to be avoided; they’re inherent features of investing landscapes to be understood and navigated. Just as farmers plant in the spring, tend in the summer, harvest in the autumn, and rest in the winter, successful investors adjust their activities to the market seasons while maintaining a long-term perspective.
As an educator, I’ve observed that the most successful students aren’t those who avoid challenges, but those who develop strategies to overcome them. The same applies to investing. Your ability to navigate market cycles with discipline and perspective may be more valuable than any stock pick or market prediction.
Remember: The cycle will turn. Bull markets will follow bears, and opportunities will emerge from crises. Your preparation, education, and emotional discipline determine whether you’ll be positioned to benefit when they do.
Disclaimer: WealthIntelReport.com is for educational purposes only, not financial advice. I am not a licensed financial advisor. Investing involves risk. Consult a qualified professional before making any investment decisions.
Ready to Continue Your Financial Education?
- Next Article: The Science of Compound Interest: Mathematics of Wealth
- Deep Dive: Understanding Economic Indicators: What Really Moves Markets
Have questions about market cycles? Visit our Contact Page or join our educational community. Understanding market cycles transforms investing from being stressful to becoming strategic!